


Now Showing in 3D – The Sewer Systems Under our Feet
Municipalities often have hundreds of thousands of assets to keep track of. Without an accurate record of each one, its location and its condition, it’s impossible for engineers and operators to properly plan maintenance and expansion. However, advances in inspection and analysis methods are changing the way we understand the infrastructure that is under our feet, giving us the ability to visualize collection system layout and capacity like never before.
With 3D modeling and computer-aided design (CAD), sewer inspection data can provide value beyond simple condition assessment. We can gain insights into how assets interoperate, the probability of failure, opportunities for optimization, and how to prioritize maintenance and rehab efforts based on asset criticality. This level of analysis is key to making more informed decisions and understanding the data as more than just numbers and variables. Fortunately, the ways in which inspection data can be interpreted continue to grow as technology advances.
Why Create a 3D Model of a Sewer System?
Just as the wastewater industry has developed new ways to maintain sewer systems, it has also found new ways to catalogue, visualize and study those systems. While 3D modeling provides anecdotal insight into the relationship between sewers and the environment they serve — topography, hydrology, population density — it also paves the way for more advanced methods of analysis.
For many municipalities, the goal is to create a virtual model of the sewer system that not only offers comprehensive visual insights, but also provides an opportunity for more innovative applications. One example of this is hydraulic modeling, which takes the model and draws conclusions on a sewer network’s performance under specific conditions. For instance, an area that is prone to flooding would benefit from knowing the likelihood of a system failure under specific levels of precipitation. Similarly, capacity studies can be done in urban areas to determine the efficacy of the current system and where there is a need for sections with higher capacity.
But the benefits of 3D modeling go beyond mainstream technology, with implications for on-site visualization via augmented or virtual reality. As technology continues to open up new opportunities, engineers are finding innovative ways to utilize these virtual models for more effective and in-depth maintenance of infrastructure.
How Is the Data Gathered?
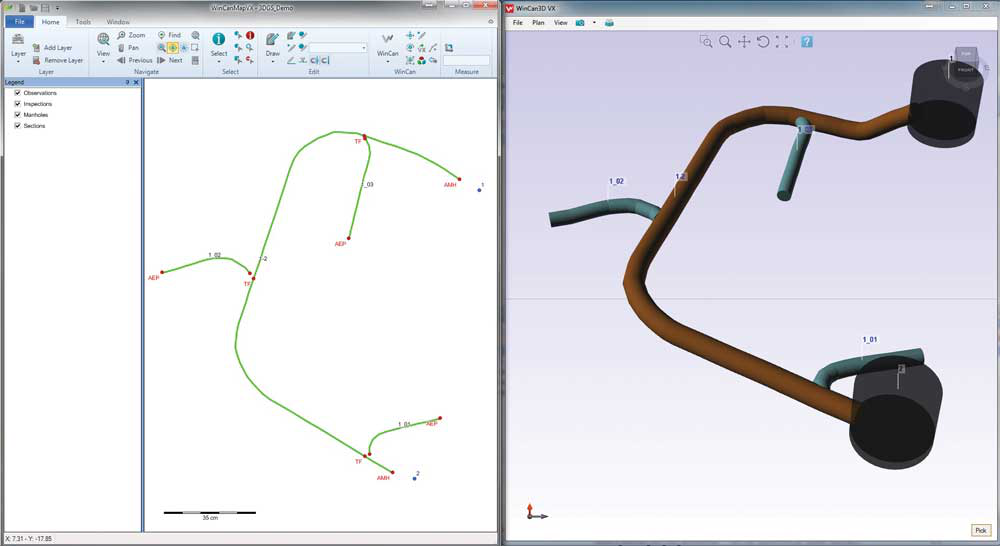
Sewer inspection crawlers come equipped with some of the most advanced technology in the industry, and whatever tech is not dedicated to maneuvering the crawler through lines is likely used to collect valuable data that can later be visualized in WinCan VX and Esri’s ArcGIS Pro.
From accelerometers (inertial sensors that can track the crawler’s travel in three-dimensional space) to distance-measuring laser rangefinders, grade-sensing inclinometers, and image measurement tools that quantify pipe features (branch angle, diameter, clock position of connections, flow level and more) — crawlers have the ability to keep track of their own location in relation to the operator and manhole, even when underground and out of range of GPS. An onboard inertial navigation system (INS), also called an XYZ sensor, can give the operator real-time data about the speed, distance and direction of the crawler, allowing for the creation of a 3D path that plots the location of the pipe being inspected.
But it’s not just sewer crawlers that have this capability. Advances in camera technology are allowing the integration of many of these same sensors in push cameras and lateral launch cameras.
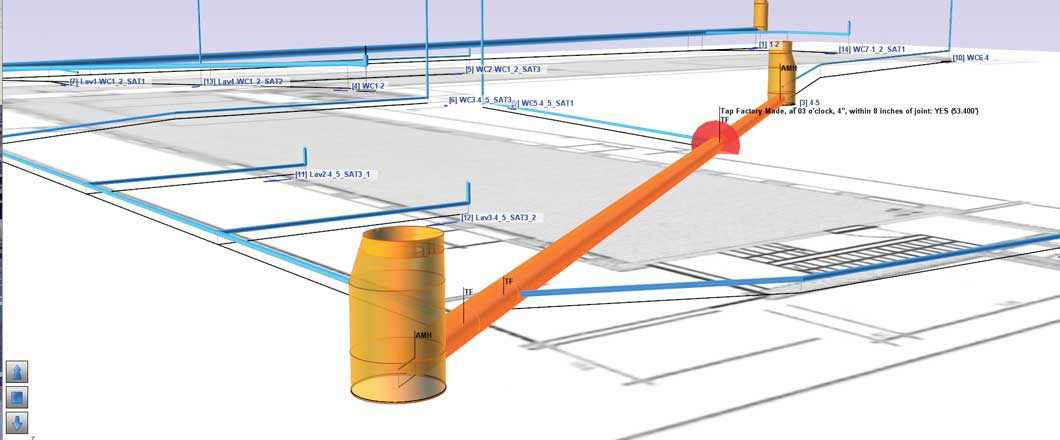
When it comes to building a 3D model, nothing is more valuable than the XYZ sensor, or INS. Because it maps a crawler’s journey through the main line, XYZ data can be easily translated into a visual representation of the pipe’s position and direction outward from the manhole. In some lateral launch crawlers and push cameras, like those from IBAK RapidView and Envirosight, these sensors can also be delivered into adjoining lateral lines, which often have more unique and meandering paths. Once a 3D model has been created in WinCan 3D, additional qualifying data (diameter, material, condition) can be overlaid to create an accurate representation of the line in virtual space.
What Does a Real-World Application Look Like?
Just north of San Francisco, the Ross Valley Sanitary District has taken its first steps toward completing a full 3D model of every pipe in the district. According to condition assessment supervisor John Vogel, the goal is to develop a more accurate understanding of how and where pipes have been laid, allowing for better informed rehab planning and maintenance procedures.
“All our maps are currently hand-drawn with best guesses as to the exact location, inclination and curvature of the pipes,” says Vogel. “Many pipes are close to homes, pools, historic trees or utilities, so we want to know where exactly the pipes are. If we know that, we can more accurately plan a project and avoid surprise costs.”
Vogel says his team has already gathered most of the necessary XYZ data using its IBAK CCTV system and a 3D Geosense module compatible with WinCan VX. And while his team may be nearly finished collecting GPS data for Ross Valley manholes, 3D Geosense collection is just beginning, and building a 3D model of the Ross Valley sewer system is a process that takes time, even with the proper measurements on hand. Still, that hasn’t stopped Vogel from thinking about the future applications of the technology, from virtual and augmented reality implementations, to simple conveniences expected to save rate-paying citizens money.
“It’s a no-brainer new technology,” Vogel says. “We always want to do the right task, at the right time, for the right reasons. 3D modeling allows us to make decisions that are in the best interest of the ratepayers, using their money more wisely and using systems that allow us to be more methodical and targeted in how we are investing.”
In Summary
The GPS coordinates of a manhole help engineers correlate connected underground geometry to surface features and topology, including the overlay of satellite maps and survey data. This gives engineers a better understanding of the geographical features that could impact the system’s performance, and when integrated with performance and operational modeling software, 3D models become invaluable tools for understanding capacity, predicting failures and planning maintenance.
While visualization of 3D data gives a clear view of a system and its surrounding area, what’s most important about 3D models of collection systems is their ability to be analyzed for performance. Software-generated simulations and analytics have the ability to identify potential risks and help us plan and maintain sewers more effectively. As communities change and new technology is developed, not only will our 3D models become more detailed, but our analysis will become more powerful and purposeful.